1 A First Taste
Fine things are difficult. — Plato, Republic 435c
1.1 What Is This Book About?
A business process is a set of steps designed to produce a product or provide a service. Most of our work life happens in performing such processes. On a daily basis, you probably encounter many different processes, even if you don’t recognize them as such. There were many processes involved in getting water and electricity to your home, for instance. You don’t have to know about those processes; you just turn the tap and the water’s there. A trip to the mailbox exposes a more legible process: Somebody wrote a letter, addressed an envelope, the postal service routed and delivered it, and now it’s in your box.
From a surgeon operating in a hospital, to a bookkeeper logging transactions in a ledger, to a teacher building a lesson plan, everywhere we look, we find work being accomplished through a repeatable set of steps. In other words, we find processes.
We also encounter broken processes, whose failures manifest as delays, missing or incorrect orders, unexpectedly high costs, or botched haircuts. If you reflect for a few moments, you can probably identify some familiar processes that need improving. But how do we make badly behaved processes better?
Try an hors d’oeuvre to whet your appetite.
You go to the Department of Motor Vehicles to renew your driver’s license. You receive a form to fill out that asks you to validate your current address. You take a ticket and wait. When your number is called you return the form and wait to have your picture taken. Then the person who takes the pictures goes to lunch, so you wait again. Finally, the staffer returns, you get your picture taken, and you go home where you can wait a final time to receive your new license in the mail.
Overall, it’s a pretty frustrating experience for you as the customer. A common and understandably human reaction to this frustration is to blame somebody, likely whichever staff member happens to be most conspicuous at the moment. That’s not process improvement.
Process improvement asks us to take a step back, to see the whole process as a system that accepts inputs in the form of material and information, and uses human labor and machinery to transform them into outputs. Process improvement studies the behavior of such systems in order to engineer better systems with better behavior.
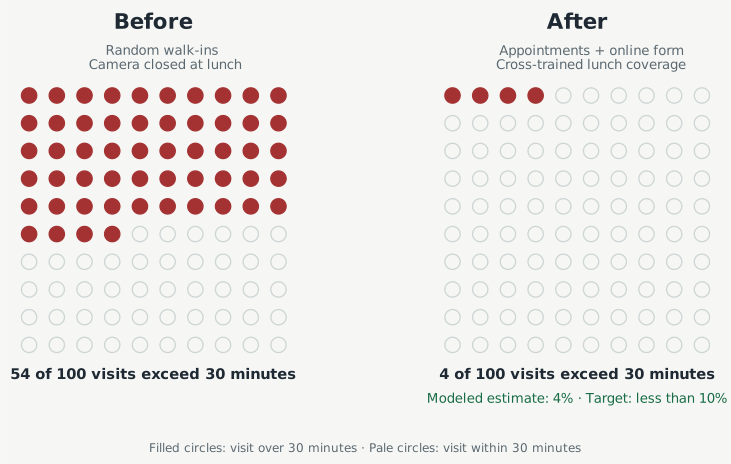
Let’s illustrate by supposing the Department of Motor Vehicles has asked us to form a small team to help improve this process. For the sake of the illustration, let’s stipulate two things. First, the experience above is not an anomaly: significant numbers of customers are unhappy with the wait time. Let’s say customer feedback indicates customers are satisfied with their experience at the DMV only if their “total visit time” from walking in the door to leaving with their business successfully completed is less than 30 minutes. On the busiest days, when 50 customers arrive for license renewals, a simple model of the current process estimates that 54% experience a total visit time greater than 30 minutes. Second, this renewal process really does require only address validation and a new photograph. (In reality, there might be other steps like a vision test, but ignore those complications for now.)
We would begin an improvement project on this process by stating the problem we’re trying to solve: on days with 50 license renewals, about 54% of customers experience a total visit time greater than 30 minutes. Let’s suppose, further, management determines it is acceptable for no more than 10% of customers to experience total visit times more than 30 minutes. This gives us what we need to formulate a simple, measurable goal: On days with up to 50 license renewals, reduce the percentage of visits lasting more than 30 minutes to less than 10 percent.
Having set our goal, next we would observe the process carefully, as it is actually being performed. We would map it out step-by-step, gathering data about how long each step takes, how often a step has to be repeated due to a quality problem, and how many trained staff are available to perform each step in the process. We would also gather data on customer arrivals, the number of license renewals per day, and so on, looking for patterns. Are there specific hours of the day, days of the week, or months of the year where the problem gets better or worse?
After gathering such data we would analyze them, using a variety of statistical techniques I describe in greater detail later in the book. The goal of such analysis is to provide insight backed by data into the causes of the process problems we are observing.
Suppose that analysis of the data reveals two key sources of our process problem:
- First, we have significant waste in the process.
Obviously the customer is likely to view the long wait as a waste of his or her time. But, the process is also wasting available capacity when the camera sits idle. Employee lunch breaks are entirely predictable, so why does the process break down due to one person’s entirely foreseeable absence? This waste is obviously driving part of the excessive wait time.
- Second, customer walk-ins drive most of the variability in the process: the number of license renewals per day varies significantly between 25 and 50, and on high-volume days the wait time explodes.
Because we have gathered the data, we are confident we have identified the most important sources of the problematic process behavior. So now, we brainstorm interventions or improvements we can make to the process to address these two issues. For the sake of concreteness, let’s say the project team includes members of the staff who actually perform this work daily. They propose a pair of interventions to address the two issues identified above which they think can be implemented successfully.
- First, the team recommends allowing customers to validate their addresses and make an appointment on the DMV website to renew their license and have the new photo taken.
An appointment system would not eliminate variation in customer arrivals completely, but it would make those arrivals more predictable and allow the office to spread appointments more evenly across the capacity available each day, which directly reduces the average time customers spend waiting for a resource. Further, even if we still allow walk-in customers, the appointment system will tend to limit the total number of customers for this process on a daily basis, which will make the process faster.1 Further, allowing the customer to populate and submit the required form information online removes the need for that step of the process in person, when our timer is ticking.
But our timer measures the visit, not the customer’s entire burden. Completing a form at home still takes time, and waiting two weeks for an appointment would not appear in our visit-time measure at all. We should check those burdens too before declaring that we have made the customer’s experience better.
- Second, cross-train multiple staff in each office on the use of the camera so that the photography station remains operational during lunch breaks and employee absences.
This intervention helps increase the total capacity of the process because the most constrained resource (the camera) can continue to operate throughout the workday, including during lunch breaks and so on.
Before changing a real office, we can use a discrete-event simulation to estimate what the combined changes might accomplish. Such a model follows individual customers as they arrive, wait for available resources, receive service, and leave, updating the system as each event occurs. The model compares repeated 50-customer days. In the current process, customers arrive randomly, service takes eight minutes on average, and the camera is unavailable for an hour at lunch. In the proposed process, appointments spread the arrivals more evenly, the online form reduces average in-person service time to seven and a half minutes, and cross-trained staff keep the camera operating through lunch.
The model predicts less waiting during the visit and fewer visits exceeding our 30-minute threshold. That prediction is a reason to try the changes, not proof that they will work in the real office. Rather than changing every office at once, the team might pilot these changes at one location, compare the results with the previous process, and revise the design in response to what we learn. Assuming the changes are effective, we could then implement them across the organization. Finally, after implementation, the team would continue to monitor performance to validate that the improved process does in fact reach the goal of <10% of customers experiencing a total visit time more than 30 minutes. If so, then we have achieved our objectives and we can document the improved process and create training materials for staff, action plans for managers, and so on to help sustain the new performance of the process. On the other hand, if we have not hit our goal, we may need to revisit the process and look to identify further improvements. This final monitoring step is crucial to prevent the process from regressing in the future.
In miniature, we have just followed the basic logic of process improvement: we defined the problem, measured the current process, analyzed the evidence, proposed and tested an improvement, and established a plan to control the process afterward. The real world is rarely so tidy, but that basic pattern will guide much of the work ahead.
Let’s conclude this illustration by briefly returning to that all-too-human impulse to place blame. I hope this little hors d’oeuvre has shown you why that impulse is counterproductive. I feel frustrated, and I can see these people, so I infer that the people I see must be the cause of my frustration. But, from a process improvement point of view, that’s very rarely the case. The people weren’t the problem; the process was. That’s why the first step in process improvement is learning to see the system.
The Real Secret of Process Improvement. The people who do and experience the work know things a statistical analysis cannot tell us on its own. That includes both the customers who experience the frustration of the bad process and the staff who have to perform it. In process improvement we value those voices because they are the ones most affected by the process and hence the ones in the best position to tell us how it should work. A premature leap to assigning blame puts people on the defensive and drastically lowers the likelihood of successfully collaborating with those whose insights we must rely upon. Thus, engagement with people is key to successful process improvement.
The Other Real Secret of Process Improvement. Listening gives us explanations to investigate; observation and analysis help us decide which ones hold up. The DMV example began with a plausible explanation about lazy staff, but the measured queue and available capacity pointed elsewhere. We need both secrets: access to people’s knowledge and a way to check our conclusions.
That, in brief, is what this book is about. Bon appétit.
1.2 What Is Lean Six Sigma?
People have probably been trying to improve business processes for as long as there have been business processes, but the “scientific” study of management techniques was born in the early decades of the twentieth century. Since then, many authors have proposed, debated, refined, and synthesized different tools and techniques into different process improvement methodologies. All these methodologies seek to carry out the work of process improvement in a structured, systematic, and evidence-based way.
Now is not the time to tell the history of the evolution of those many methods. Instead, I simply note this book uses the Lean Six Sigma (LSS) methodology as its point of departure for two practical reasons.
- First, LSS has a deep history, a large practice community, and robust adoption across a variety of domains.
- Second, it gives us a practical way to identify waste and variation, test better ways of working, and make gains stick over time.
In short, this book treats LSS as an established, disciplined approach to process improvement in the real world.
Lean and Six Sigma were two distinct traditions fused into a single methodology.2
- Lean traces its roots to the Toyota Production System, developed in Japan in the decades after World War II. At its core, Lean is about identifying and eliminating waste in its various forms: waiting, excess inventory, unnecessary motion, rework, overproduction. Lean offers a set of principles and tools for mapping how work actually flows, spotting where it gets stuck or distorted, and redesigning the process so that value moves cleanly from start to finish.3
- Six Sigma was developed at Motorola in 1986 in response to quality problems.4 The methodology then spread elsewhere, notably to General Electric in the 1990s, where CEO Jack Welch touted its positive impacts on the business. Its focus is on reducing variation: the frustrating reality that even well-designed processes produce inconsistent outputs. A process that works correctly nine times out of ten still produces a defect one time in ten, and over thousands or millions of cycles, that adds up fast. Six Sigma provides statistical tools for measuring how much variation exists, diagnosing its root causes, and controlling the process tightly enough that defects become rare. At its most basic, LSS applies the scientific method to improve business processes.
Combined, Lean Six Sigma immediately gives us two useful lenses to inspect a process: look for the waste that slows the work down and the variation that makes its results unpredictable. Although the Lean Six Sigma body of knowledge evolved primarily in the world of heavy manufacturing, today you can find process improvement practitioners applying Lean Six Sigma methods and tools in many service industries, especially healthcare.
For our purposes, the key idea is simple: LSS is a structured, evidence-based way to make work better with broad adoption across a variety of industries. That makes it a natural place to begin teaching process improvement.
But, even though the spine of the book is built around LSS, we will freely borrow tools or techniques from other frameworks whenever we need them. After all, what matters is solving problems, not what we call the tool we use to do it or who created it or where it came from. And when the tool we need doesn’t exist—whether in Lean Six Sigma or some other framework—we build it.
1.3 Who Is This Book For?
This book is for anyone who is willing to commit to the hard work of improving themselves and their business. Process improvement practitioners follow the philosophy of continuous process improvement: we strive daily to find better ways to serve our customers and improve our business processes. We want to be responsible stewards of scarce financial resources. We want to be humane managers who value our employees and seek to increase their engagement and satisfaction at work. Learning to do these things isn’t easy, exactly. But it’s also not some esoteric mystery available only to graduates of a fancy business school. The work begins with careful observation and familiar questions about what happens and why. The methods in this book help us answer those questions reliably. You can learn to do it too if you’re willing to put in the time and effort.
Unfortunately, I can’t say exactly how much time and effort, because I don’t know you, your educational background, or your experience with this sort of work. If you have a degree in industrial engineering and 20 years of work experience, I would expect you to breeze through most of the material here fairly easily, at least at the early stages. On the other hand, if you are just starting your career and your education has not been primarily in engineering or a related discipline, you’ll need to put more time and effort into acquiring some of the foundational concepts. However, while relevant education and work experience are certainly helpful, they are not necessary. You absolutely can succeed in this field without a college degree in engineering, or anything else for that matter. It is just going to take you a little longer and require a little more effort.
Anything worth learning takes work. That is as true of shaving a few strokes off your golf game or mastering a new piece on the guitar as it is of learning a new set of business tools. Don’t worry; it’ll be a lot of fun too.5
There is another audience I want to identify. This book is also for teachers. I offer these materials to the public under the Creative Commons Attribution 4.0 International License (CC BY 4.0). This means you may freely read, copy, share, change, remix, and otherwise use this content as you see fit, so long as you provide attribution back to the original work here. If you do find the material useful, or especially if you end up adopting it for a Lean Six Sigma course of your own, please drop me an email at [email protected]. I’d love to hear what you’re teaching and which parts of the book help your students. And, of course, typos, bugs, comments, and constructive criticism are always welcome. Please find more details at LICENSE.md. Note that the Creative Commons license only covers content I created—any additional materials that I have cited or included here remain under their original licenses.
1.4 Why Another Lean Six Sigma Book?
There are already excellent Lean Six Sigma and process improvement books available. So why another one?
As an instructor, I have struggled to find a single text to give my students that meets three criteria:
First, it should be practical without becoming shallow. Some advanced industrial engineering and operations research texts are mathematically rich but too far removed from day-to-day service work to be accessible to the broad audience interested in process improvement. Others are highly accessible but leave learners unprepared for the jump from introductory material to the more advanced statistical analysis real-world projects frequently require.
Second, the text should function as an actual learning system, not just a reference or certification exam prep manual. My aim is to bridge that gap with a coherent progression of topics, steadily building the mathematical and conceptual foundations but pairing those with practical illustrations and applications. Additionally, such a text requires a sufficient number of exercises, engaging examples, and a structure that works for both self-study and classroom delivery. The goal is understanding and transfer, not rote memorization.
Third, it should be built around open-source tooling and reproducible, scalable workflows. As data and teams grow, our analyses need to remain repeatable and open to inspection. Many common training and industry workflows still rely on proprietary statistical tools, like Minitab or SPSS. Those tools can be useful, but they also create real barriers: high license costs, limited access for students and small organizations, and difficult handoffs when teams use different software.
To reduce these barriers, I have chosen to build the content, examples, and exercises of this book using the Python programming language. Python becomes central at the later belt levels; White Belt deliberately establishes the method with pencil-and-paper tools and elementary arithmetic. Python combines a relatively gentle learning curve for programming novices with an exceptionally mature ecosystem of free, open-source tools for data cleaning, visualization, statistical analysis, and automation. It is also widely used across universities and industry, and in the data science and machine learning communities, which opens up new possibilities for collaboration and cross-pollination. This means improvement work can be inspected, version-controlled, reviewed in plain text, reproduced by others, and sustained without vendor lock-in. Moreover, the Python skills, scripts, and project artifacts you build during your work in this book are portable. In a classroom, this lowers the cost of learning and makes assignments easier to grade and audit. In organizations, it makes improvement claims easier to validate, maintain, and scale.
So the project is ambitious, but straightforward: provide a practical, pedagogically sound, open-source path for learning and doing process improvement roughly organized around the traditional Lean Six Sigma curriculum. If the book manages to achieve these three goals, I think it will provide a meaningful contribution to the literature. If it helps students and teachers learn to improve real systems with more clarity and less waste, it has done its job.
But the book is also ambitious in a further way.
1.5 Beyond Traditional Lean Six Sigma
The familiar Lean Six Sigma toolkit of process maps, control charts, fishbone diagrams, linear regression, and so on, remains essential. But consider some questions our DMV team might still need to answer. How often do customers follow each path through the process? Can another analyst reproduce our calculation of waiting time when next month’s records arrive? What happens to the proposed design if demand increases or a second employee is absent?
A process map or a summary statistic can help us ask these questions, but neither can answer all of them alone. We need explicit descriptions of the work, trustworthy records, repeatable calculations, and ways to investigate how changes might interact. This book therefore expands both the tools we use and the methods we teach. Two tools we have created for this work are FLO and lss4py. We also give established methods such as process mining and discrete-event simulation a deliberate place in the curriculum.
1.5.1 Process modeling with FLO
Imagine that our DMV team has drawn a process map and agreed that it describes the work accurately. We want to preserve that shared understanding, revise it as the process changes, and make its structure available to software as well as people. FLO is a plain-text language for describing a process explicitly: its steps, decisions, roles, resources, and connections. From that description, FLO can check the model’s structure and generate diagrams for review.
The advantage is that the description remains available for inspection and reuse. We can record successive versions, compare what changed, and regenerate a diagram from the revised model. If our DMV team changes who performs a task, the model can preserve that change alongside the rest of the process description. Other software can use the structured model for analysis; simulation also requires its own assumptions about arrivals, service times, and resource availability. FLO supplies the process representation, not a simulation engine.
1.5.2 Repeatable process calculations with lss4py
Suppose the DMV sends us another month’s visit records. We should be able to apply the same calculation of elapsed time from arrival to departure, rather than reconstructing it by hand each month. The lss4py Python package provides reusable calculations for selected process measures, including elapsed time through a process and the proportion of that time spent on value-adding work. We will meet these measures in more detail as we need them.
Using a shared calculation makes it easier to apply the same definition consistently, rerun an analysis on new records, and let another person inspect the work. Because the package is open-source, its calculation methods can be inspected too. We still have to decide which measure answers our question, check the inputs, and interpret the result. The package’s role in this book is to support that work alongside other Python libraries, beginning with these concrete process calculations.
1.5.3 Data wrangling and data science skills
Some LSS training curricula simply provide the student with datasets that have already been prepared for analysis. In the real world, the practitioner often has to do this preparatory work. Our DMV records might contain missing departure times, duplicate visits, or different names for the same activity across offices. Before calculating anything, we need to understand those records and decide how to handle their defects. In practice, improvement work is often blocked not by a lack of analytical tools but by messy, incomplete, or hard-to-access data. This book treats obtaining, cleaning, combining, reshaping, and validating data as part of process improvement itself. Those decisions help determine whether an apparently precise answer deserves our trust.
1.5.4 Advanced methods where they are warranted
Some process questions require us to examine how work moves through time, how resources constrain it, and how observed paths differ from the ones we intended. Three methods help us do that:
- Queueing theory studies how work waits for service. At the DMV, it helps explain why uneven arrivals can produce long waits even when the office appears to have enough capacity on average. It gives us a way to reason about the interaction of demand, variation, and available capacity.
- Discrete-event simulation follows individual cases and resources through a modeled process, as in the DMV illustration above. It lets us explore how appointments and lunch coverage might work together, or how the proposed design behaves under heavier demand, before committing an office to the changes. Its predictions depend on the assumptions we build into the model and must be checked against the real process.
- Process mining uses an event log: records identifying each case, the activities performed, and when they occurred. If the DMV records these events for each visit, we can investigate whether customers follow the advertised sequence or return to address validation after reaching photography. Mining can reveal recurring paths, repetitions, and differences between recorded work and the intended process. It cannot reveal work the log never captured, so we must check what we find against observation and the knowledge of the people doing the work.
These methods extend the core LSS framework by helping us answer questions that a map or a single average leaves unresolved. Their value lies in the question they help us answer and the evidence they let us examine.
Together, the tools and methods support a connected investigation. FLO makes the process description explicit; lss4py supplies selected calculations from observed data; process mining investigates recorded paths; and discrete-event simulation explores proposed changes under stated assumptions. Each contributes a different part of the reasoning, and we must check that the descriptions, records, calculations, and assumptions agree. I think this is a better way to teach improvement because learners can follow the reasoning from a description of the work to evidence and a proposed change. They can examine the assumptions, repeat the analysis, and revise it when the process contradicts them.
You do not need to learn all of this at once. White Belt begins with observation, pencil-and-paper tools, and elementary arithmetic. Yellow Belt introduces writing FLO models and basic Python analysis; Green Belt deepens independent work with data and reproducible workflows. The planned Black Belt material teaches learners to build simulations and apply process mining, with Master Black Belt emphasizing judgment about their use in wider systems. That higher-belt material is still under development. For now, the point is to see where the foundations lead and why the later tools are worth learning.
1.6 Conclusion
The DMV example gave us a first taste of how observation and measurement can challenge an explanation that initially seemed obvious. White Belt asks you to follow that logic through a complete cycle: observe a small process, test a change, and decide what the result warrants. We’ll begin with the language needed to describe the work.
Giddy up.
You’re just going to have to take my word for that for now. We’ll meet this principle formally in Section 9.10.↩︎
The integration of the two traditions appears to have begun with George (2002).↩︎
The use of the word “Lean” to describe production systems inspired by Toyota originates in Krafcik (1988), which is primarily investigating how a production policy that runs with small inventory buffers can lead to improved throughput while maintaining high quality. Such systems are “leaner” than traditional manufacturing methods which require larger inventory buffers. Womack and Jones (1996) helped popularize the term.↩︎
In fairness, I have been accused of having an idiosyncratic definition of “fun.” But just because something’s hard doesn’t mean it’s not fun; quite the opposite. Chess is more fun than tic-tac-toe because it’s harder.↩︎