flowchart LR
    QE([Queue Entry]) -- "W/T" --> SS([Setup Start])
    SS -- "S/T" --> WS([Work Start])
    WS -- "P/T" --> WE([Work End])
8 Building the Current-State Process Map
The map is not the territory. — Alfred Korzybski
8.1 Why This Chapter Matters
“Don’t they make a tool for this?” is a common reaction when process mapping gets messy. Tools help, but the real bottleneck is usually the quality of your observations, not software. The completed event log introduced in Chapter 7 preserves what happened to individual Wash n’ Fold orders and to the loads created from them. That evidence is trustworthy, but dozens of rows still do not give us a picture we can inspect all at once. This chapter shows how to summarize those records without losing their provenance, turn the summaries into a current-state map, and verify that the model represents the work fairly.
8.2 Learning Objectives
By the end of this chapter, the student will be able to:
- Lean Six Sigma Principles and Tools Classify each process step as value-added (VA), required non-value-added (RNVA), or non-value-added (NVA) from the customer’s point of view Bloom:Analyze
- Data Understanding Aggregate comparable records using count, sum, and mean while preserving the observation unit, and explain what may be concealed when a mean is transferred to a process map Bloom:Analyze
- Data Understanding Convert a completed map worksheet into a current-state SPPM that represents supported queues, release delays, handoffs, and rework without presenting hypotheses as observations Bloom:Apply
- Data Understanding Verify a first-pass map with a process participant and record accepted or rejected revisions with reasons Bloom:Evaluate
Chapter 7 laid out the complete nine-step workflow and produced timestamped Wash n’ Fold observation records through Step 5. We begin with Step 6: calculate the timing intervals those records support. Then we carry the calculated evidence through the worksheet, visual map, and participant verification.
8.3 Wash n’ Fold Project: From Records to a Map
The event log follows 39 customer orders through the approved drop-off-to-notification boundary. It contains one order-level record for activities that act on the whole order and one record per physical load for Wash and Dry: 65 Wash records and 65 Dry records in all. Parent Order IDs, child Load IDs, roles, timestamps, and five recorded Fold corrections preserve the connections among those records. We will use those records to decide what can be combined, what must remain visible, and what the resulting map does—and does not—allow us to conclude.
8.4 Calculate Each Activity Record’s P/T, W/T, and S/T
The timestamp columns in the event log contain observations. Processing time, wait time, and setup time are derived values calculated from those observations on the timing calculation worksheet:1
\[ \mathrm{W/T} = \text{Setup Start} - \text{Queue Entry} \]
\[ \mathrm{S/T} = \text{Work Start} - \text{Setup Start} \]
\[ \mathrm{P/T} = \text{Work End} - \text{Work Start} \]
A missing timestamp is unknown, not zero. When an activity has no setup, Setup Start equals Work Start and its S/T is zero.
8.4.1 Know the Three Timing Labels
The log captures four timestamps: Queue Entry, Setup Start, Work Start, and Work End. They mark three distinct intervals. Learn the labels before calculating them on the worksheet or using them in the map:
Definition 8.1
NoteDefinition: Processing Time
P/T means processing time. For one pass through an activity, processing time is the elapsed time from Work Start to Work End while the unit is actively being processed. Average processing time is the arithmetic mean across comparable activity records. Write Avg P/T when transferring that mean to the worksheet or map.
Definition 8.2
NoteDefinition: Wait Time
W/T means wait time. For one pass through an activity, it is the elapsed time from queue entry until setup starts; if there is no setup, it ends when work starts. Average wait time is the arithmetic mean of those observed waits; label the summary Avg W/T. All queue time is wait time, whether or not you later choose to draw that queue as its own symbol on the map.
Definition 8.3
NoteDefinition: Setup Time
S/T means setup time. For one pass through an activity, setup time is the preparation interval from Setup Start to Work Start. Average setup time summarizes comparable observed preparation intervals; label it Avg S/T. Record it separately from queue wait time. Record 0 only when no setup occurs; leave unobserved setup time unknown.
Definition 8.4
NoteDefinition: Changeover Time
Changeover time, written C/O, is the setup time required to switch a process from one product, service, batch type, or operating mode to another. Every changeover is setup, but not every setup is a changeover. Use C/O only when the observation records an actual transition and identifies what changed.
For one load of laundry waiting to be washed, the three labels describe different parts of its visit to the washing step:
- W/T: The load enters the washing queue at 10:00, but the worker does not begin preparing the washer until 10:15. Its wait time is 15 minutes.
- S/T: The worker spends 3 minutes gathering supplies, checking the machine, and selecting the load’s settings. Its setup time is 3 minutes. If the record separately established that the worker was switching the washer from a different mode, that transition could be reported as C/O.
- P/T: Once the washer starts, the wash cycle runs for 25 minutes. Its processing time is 25 minutes, even though the worker can attend to other tasks while the machine runs.
For these recorded intervals, waiting ends when setup starts, setup ends when work starts, and processing time ends when the work for that pass finishes. Automatic machine processing can count as P/T even when no worker is occupied throughout.
The completed Wash n’ Fold record makes the distinction visible: its timestamps are the evidence, while W/T = 90.8, S/T = 1.6, and P/T = 29.4 minutes are calculations based on that evidence. Keep each calculated value connected to the same record before grouping comparable rows.
Use the Mapping Worksheet Set to make that connection visible on paper before asking a spreadsheet, a script, or a process-mining tool to do it at scale. It contains two physical worksheets with one job each: calculate timing values for individual records, then summarize comparable calculated records for the map.
- Download the editable Mapping Worksheet Set (XLSX)
- Download the Timing Calculation Sheet as an A4 color PDF, A4 B&W PDF, Letter color PDF, Letter B&W PDF, or CSV.
- Download the Map Summary Sheet as an A4 color PDF, A4 B&W PDF, Letter color PDF, or Letter B&W PDF.
- Download the Map Summary Sheet CSV.
- Inspect the short worked example as an editable workbook or printable worksheet set.
- Keep the full completed references available: Mapping Worksheet Set XLSX, Timing Calculation Sheet in a browser or PDF, and Map Summary Sheet in a browser or PDF.
Start with the five records in the short event-log excerpt: activity Wash, Child ID L1, and Parent IDs WNF-001 through WNF-005. Transfer their Parent ID, Child ID, timestamps, rework flag, and factual notes from the event log to the Timing Calculation Sheet. Calculate W/T, S/T, and P/T for each row, keeping every result beside the timestamps that support it. Then transfer the five calculated rows to one Map Summary Sheet row as n, timing sums, and averages, with a note about what varies or needs verification. Compare that result with the short worked copy before opening the full references.
The timing workbook expects numeric elapsed minutes from one stated origin. If your event log uses absolute Excel date/times, first convert each timestamp to elapsed minutes with (timestamp - clock origin) * 1440. That converts Excel’s days to minutes while retaining the original clock in the log. Each duration formula checks only its own two endpoints: knowing Work Start and Work End lets you calculate P/T even if Queue Entry is unknown. For more records, add rows within the workbook’s timing table and copy the W/T, S/T, and P/T formulas into those rows. The printable sheets leave room for writing; repeat a blank page when you need more records.
Next, repeat the timing calculation for the complete parent order WNF-003, using its source excerpt (CSV) or PDF. Its order-level records, compatible load records, and Fold correction make a useful check on the distinction between a record-level calculation and an order-level story. Compare your nine rows with the completed timing sheet (PDF) or CSV. Do not sum its child-load timings and call the result its elapsed lead time. Chapter 9 returns to the parent-order projection when that is the question being asked.
8.5 Build the Map Summary Sheet
Step 7 moves from calculated individual activity records to activity summaries. Group records with the same activity and a comparable process path and operating context. They must also describe the same kind of observed unit. Do not average order records and load records together or hide a meaningful variant in one row.
The Map Summary Sheet is the second worksheet in the set. For each map candidate, it records the activity or queue, observation unit, \(n\), timing sums and averages, role, value classification, type, variation or evidence note, and a clear instruction for the eventual map. The completed Wash n’ Fold reference shows the target result without replacing the arithmetic you perform on the five-record practice group. The compact Process Map Worksheet is an alternative paper summary after the event log and timing calculations are complete. It summarizes activities; it does not replace the observation record.
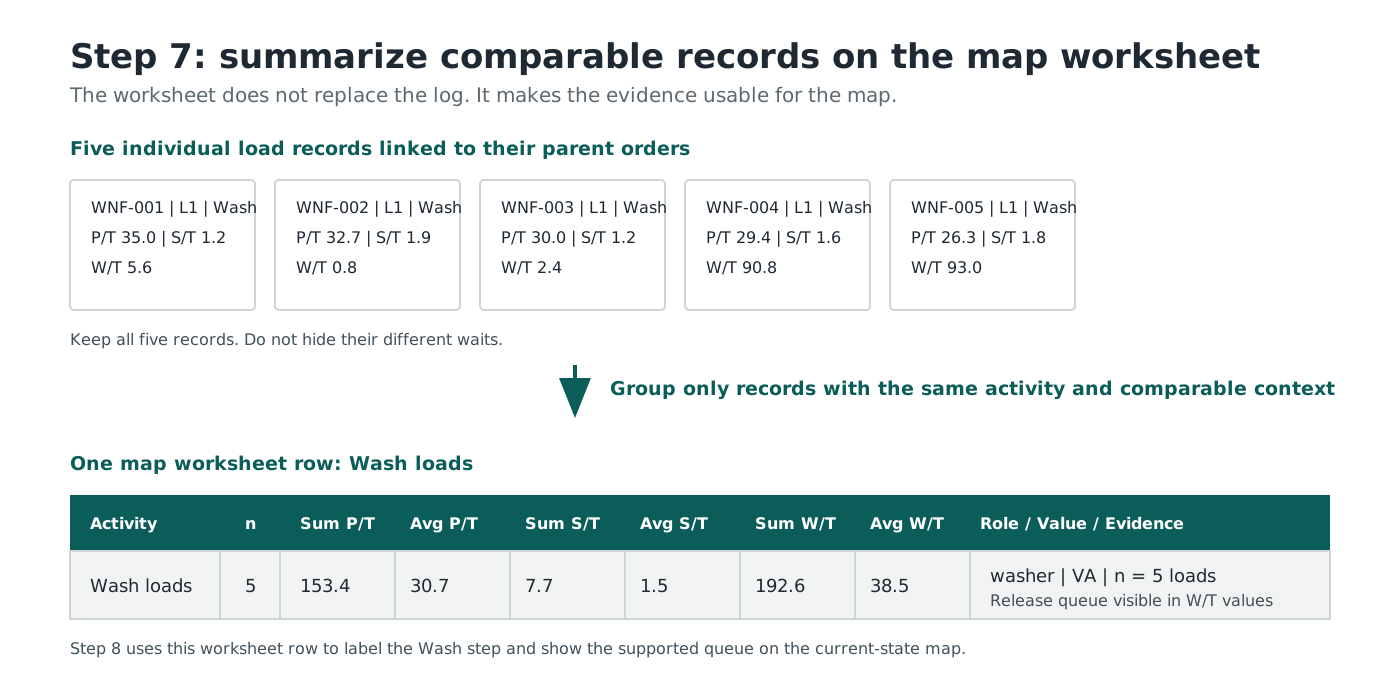
Each named activity receives its own row. Record roles rather than employee names so ownership remains understandable when staffing changes.
Definition 8.5
NoteDefinition: Decision
A decision identifies the point where a process can follow alternative paths. If making the decision consumes work or waiting time, preserve that time in the log.
The count \(n\) records how many comparable activity records support a timing summary. State what those records represent: \(n=39\) orders is not interchangeable with \(n=65\) loads. For each timing column, count the observations, add them while preserving the recorded time unit, and divide the sum by \(n\). For example, if five comparable waits sum to 27 minutes, then \(n=5\) and \(\mathrm{Avg\ W/T}=27/5=5.4\) minutes. Record the sum as well as the mean so another reader can check the arithmetic. Round only the final mean, not the individual observations or partial sum; unless the project requires another convention, report one more decimal place than the original whole-unit observations and otherwise retain the precision of the recorded timestamps. These are summaries of the recorded observations, not additional stopwatch readings.
If different timing columns have different numbers of complete observations, state their counts separately. Notes record the source log/window, units, classification reasons, variants, rework trigger and destination, and questions for participant verification. A repeated activity can produce more records than there are distinct work units.
After the timing evidence, record Value as VA, RNVA, or NVA from the customer’s perspective and Type as step, queue, or decision. A step is work, a queue is a waiting state, and a decision identifies alternative paths. These classifications still matter, but they do not replace the counts, sums, and averages that support the map.
8.5.1 Classify Value Type (VA/RNVA/NVA)
Before classifying activities, agree on the value-classification rules. Without a shared convention, two people can map the same process and produce incompatible classifications.
Use the customer’s point of view as the filter and apply the same three-part test to every step.
Definition 8.6
NoteDefinition: Value-Added Process Step
A process step is a value-added process step only when it passes this three-part test:
- (i) Customer value: The step directly creates or advances an outcome the customer receives and values.
- (ii) Transformation: The step changes the form, fit, function, information, or condition of the product or service toward that outcome.
- (iii) Right first time: The step is performed correctly without creating a need for correction or rework.
Definition 8.7
NoteDefinition: Non-Value-Added Process Step
A non-value-added process step fails one or more parts of the value-added test and is not currently required to deliver the product or service safely and reliably.
Definition 8.8
NoteDefinition: Required Non-Value-Added Process Step
A required non-value-added process step fails one or more parts of the value-added test but is currently required by law, regulation, contract, a documented safety or control need, or another necessary condition of delivering the service reliably. Record the specific requirement rather than treating RNVA as a permanent exemption from improvement.
TipA Word on the Human Side
Value classification can feel personal to operators and managers. When facilitating this step, emphasize that “non-value-added” describes the activity from the customer’s perspective, not the worth of the person doing the work.
It is very important not to make people feel like you are diminishing the importance of their contributions.
Every process step must fall into exactly one of these three exhaustive and mutually exclusive categories:
- VA (value-added): steps that pass all three parts of the customer-value, transformation, and right-first-time test. Examples: machining a part, cleaning garments, completing a clinical procedure.
- RNVA (required non-value-added): steps required by regulation, contract, billing, or safety controls. Examples: identity verification, compliance documentation, payment capture.
- NVA (non-value-added): steps that add no customer value and are not required. Examples: waiting in queue, re-entering duplicate data, moving work because of poor layout.
TipPro Tip: Document Why a Step is Required
In the Notes column, record exactly why a RNVA step is required. If a specific policy or regulation requires it, find the reference. This matters for three reasons.
- Documentation quality. Understanding the regulatory context makes it much easier to periodically review for policy changes.
- Policies change. A step that was once required may no longer be—or new requirements may have been added that you aren’t currently meeting. Compliance is a moving target; always do your homework.
- Some “policies” are not actually policies. Certain bosses speak with such commanding air that their personal preferences solidify in the minds of employees—and themselves—as official policy, when in fact they are nothing of the sort. If you stick around process improvement long enough, you’ll eventually get to have a really fun one-on-one with somebody’s boss’s boss about one of these “shadow” policies.
8.5.2 Classify the Wash n’ Fold Activities
The customer receives clean, dry, folded laundry. Wash, Dry, and Fold and package directly transform the order and are VA. Drop-off and ticket, Sort and tag, and Stage and notify are required for identification, safe processing, and return, so this case treats them as RNVA. Waiting and correction work are NVA.
| Activity | Role | Value | Type | Case-specific reason |
|---|---|---|---|---|
| Drop-off and ticket | Customer, Staff | RNVA | Step | Establishes order identity, requirements, and traceability. |
| Sort and tag | Staff | RNVA | Step | Protects the order and determines compatible washing groups. |
| Wash | Staff | VA | Step | Cleans the laundry. |
| Dry | Staff | VA | Step | Dries the laundry. |
| Fold and package | Staff | VA | Step | Produces the folded, packaged result. |
| Stage and notify | Staff | RNVA | Step | Makes the finished order findable and communicates readiness. |
8.5.3 Aggregate Comparable Activity Records
First choose the five comparable Wash rows you calculated on the Timing Calculation Sheet. Using those P/T, W/T, and S/T values, enter the count, sum, and average for each timing label on the Map Summary Sheet. For P/T, the count is 5, the sum is 153.4 minutes, and the mean is \(153.4/5=30.68\), displayed as 30.7 minutes. Write a variation or evidence note before drawing anything: five rows are practice evidence, not proof that all Wash loads behave alike. That five-row exercise does not replace the complete 65-load summary.
After completing that small exercise, use the supplied activity summary as the worked reference for all 39 orders and their 65 loads. The Map Summary Sheet preserves the count, sum, and mean for P/T, W/T, and S/T because those are the values needed to check and label the map. Its variation or evidence note should still record anything the mean may conceal, such as a wide spread, an unusual observation, or a changing queue. Chapter 9 returns to the underlying observations and teaches how distributions, ranges, medians, and percentiles expose those patterns more directly.
The process map follows customer orders, so its Batch Release queue uses a separate order-level projection. For each order, measure from Wash queue entry to the first load’s setup start; across 39 orders, that mean is 501.7 minutes. Do not average 65 load waits and label the result as 39 customers’ average wait.
The completed main-path timing summary is below; all sums and averages are in minutes. The role, value, type, and classification reasons remain in the context table above. The observation basis is explicit because Wash and Dry contain 65 load records while the other main activities contain 39 order records.
| Activity | n | Sum P/T | Avg P/T | Sum S/T | Avg S/T | Sum W/T | Avg W/T | Rework trigger? |
|---|---|---|---|---|---|---|---|---|
| Drop-off and ticket | 39 | 115.2 | 3.0 | 0.0 | 0.0 | 197.8 | 5.1 | N |
| Sort and tag | 39 | 187.6 | 4.8 | 0.0 | 0.0 | 174.1 | 4.5 | N |
| Wash loads | 65 | 1,977.2 | 30.4 | 96.9 | 1.5 | 32,560.1 | 500.9 | N |
| Dry loads | 65 | 2,944.9 | 45.3 | 42.5 | 0.7 | 51.8 | 0.8 | N |
| Reunite, fold, and package | 39 | 630.8 | 16.2 | 19.5 | 0.5 | 139.4 | 3.6 | Y |
| Stage and notify | 39 | 155.0 | 4.0 | 0.0 | 0.0 | 1,479.1 | 37.9 | N |
The five Fold correction records form an observed NVA rework path. Their mean P/T is 6.8 minutes and mean W/T is 5.6 minutes.
8.6 Draft the Visual Map (SPPM Conventions)
When translating the map worksheet into a diagram, use one symbol system consistently. SPPM is our teaching label for a simplified set of widely used workflow and value-stream conventions. It is not a brand-new notation invented from scratch.
| Symbol | Shape / Line | Meaning |
|---|---|---|
| Process step | Rectangle | A unit of work performed by a role; colored by value type (Green = VA, Gray = RNVA, Red = NVA) |
| Data box | Small box below step rectangle | Records role, Avg P/T/S/T/W/T, and sample count or a shared evidence reference |
| Queue / waiting state | Triangle (light orange) | A queue of work items waiting for the next step; size or label states a time-stamped queue count or average wait time |
| Subprocess | Double-line rectangle | A step that can be exploded into its own detailed map; see separate detail map |
| Decision / approval | Diamond (light yellow) | A branch point (approval, check, gate) where variants diverge |
| Start / stop event | Rounded rectangle | Scope boundary from the customer’s perspective |
| Forward progress | Solid arrow | Normal flow from one step to the next |
| Rework loop | Dashed arrow | Work returns to an earlier step due to defect or mismatch; label with rework rate (e.g., “5%”) |
When a wait moves from a worksheet row into its own queue symbol, count it only once. A map caption should state units, the observation window, and that displayed timings are means. Keep the detailed records and worksheet beside the map; readers need a legible view of the flow without losing access to its evidence.
Use the customer-facing boundary unless you explicitly declare a narrower scope. We will now apply this visual grammar to Wash n’ Fold, including data boxes, queue triangles, and rework notation.
8.7 Select Queues and Draw the Current-State Map
Step 8 chooses which worksheet evidence must remain visible on the map.
Every W/T remains in the evidence table, but not every small delay needs its own map symbol. The 501.7-minute order-level mean Batch Release queue before Wash dominates the current-state picture. The 37.9-minute Notification Batch queue is also persistent and meaningful. We promote both to explicit queue triangles.
Inspect the order-level Batch Release projection (CSV) or its printable derivation. It keeps one row per order: the earliest Wash setup start minus the earliest Wash queue entry for that order. The mean of those 39 waits is 501.7 minutes; the mean across 65 load waits is 500.9 minutes. The map uses the order-level queue label because its boundary follows a customer’s order. It does not add that label to the load-level wait as though they were two separate delays.
Five of 39 orders failed the packaging check and entered Fold correction, so the map includes an evidenced correction branch. No recurring machine breakdown or other interruption appears in the selected observation window; those remain Not evidenced rather than being added from speculation.
8.7.1 Draw the Selected Evidence
We now translate the verified evidence into a Simplest Possible Process Map (SPPM). The task boxes carry mean P/T and S/T with their observation basis. The two major queue triangles carry mean W/T; the correction branch has its own wait and n = 5. Here \(n\) counts activity records. On this Friday, each affected order has one recorded correction. The correction branch records its observed frequency, while the smaller waits remain available in the completed table.
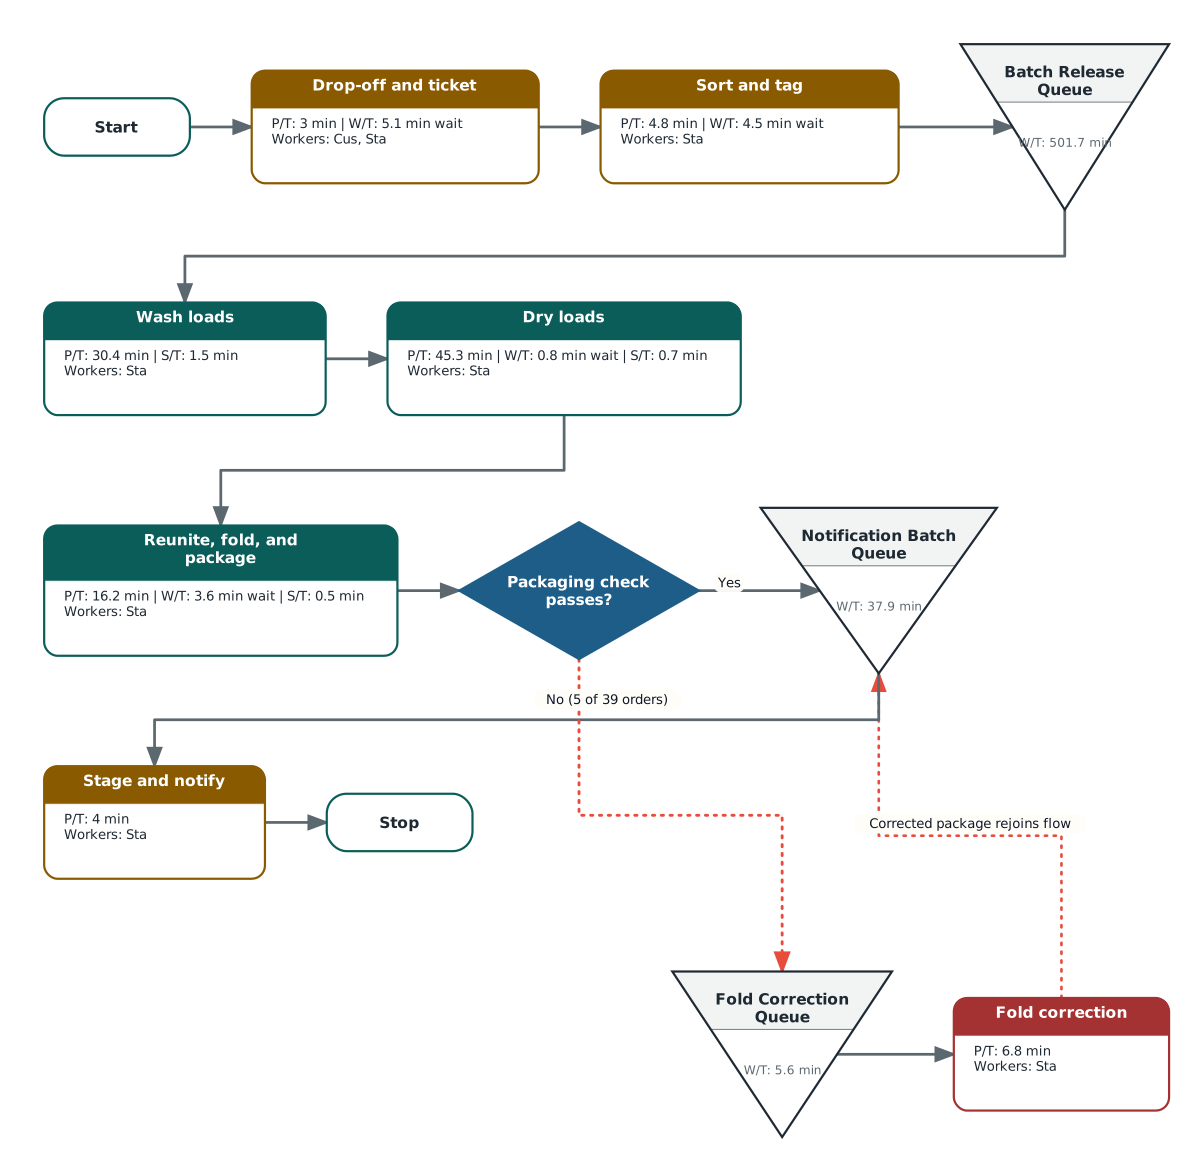
Download the printable current-state map to keep beside the worksheets.
All P/T, S/T, and W/T labels in this map mean averages from Friday 91. Wash and Dry summarize 65 load records; the other main activities and the Batch Release queue summarize 39 orders; correction work has \(n=5\). A promoted wait belongs to its queue symbol, not a second copy inside its task box. Minor waits remain in the worksheet and must be included in process-level calculations.
The map is intentionally an averages-level summary. It does not replace the event log or claim that every order waited exactly the same amount of time.
8.8 Verify the Map with a Participant
Before baseline analysis, review the draft map with at least one process participant and, when those are different people, the process owner. Ask the reviewer to walk one recent work unit through the drawing rather than merely asking whether the map “looks right.” Record each proposed correction and whether you accepted or rejected it, with a brief reason. Use the blank Participant Verification Record as a PDF, XLSX, or CSV. It records the questioned feature, observed evidence or participant explanation, proposed revision, decision, reason, and the log, worksheet, or drawing updated.
Use this checklist during the review:
- Boundary drift: start/stop points change mid-analysis.
- Averaging too early: high variation gets hidden in one number.
- No wait-time capture: map shows activity but not delay.
- Policy mapping: documented process, not observed process.
- Missing ownership: handoffs are not explicit.
- No rework notation: loops vanish from the visual.
- Variant representation: decision points and branch paths are marked where variants occur.
Step 9 tests the first-pass representation against participant knowledge and the supplied records.
To see why participant verification matters, suppose the team first sketches Wash and Dry as though each order moved through them as one machine load. That drawing conflicts with the event log, which contains separate L1 and L2 records for many orders. During verification, the operator explains that lights, darks, fabric-care needs, soil level, and order weight may split an order into compatible loads. Those loads are never mixed with another customer’s order and must reunite before folding. The data support the correction: 26 of the 39 observed orders used two loads, producing 65 Wash and 65 Dry records.
We keep a revision record instead of silently redrawing the map:
| Proposed revision | Decision | Reason |
|---|---|---|
| Show compatible loads through Wash and Dry, then reunite before folding. | Accepted | Operator explanation agrees with the order context in the event log. |
| Add a Fold correction branch. | Accepted | Five orders contain explicit correction evidence. |
| Promote the Batch Release and Notification Batch waits to queue symbols. | Accepted | Both delays are persistent and material in the timing summary. |
| Extend the boundary through customer pickup and payment. | Rejected | Pickup, payment, and customer travel are outside the approved improvement boundary. |
| Add a machine-breakdown interruption. | Rejected | No recurring breakdown is evidenced in this observation window. |
The worked Participant Verification Record is available as a PDF, XLSX, or CSV. It expands this case review with evidence and revision references; it is not a record of an actual interview.
With participant verification complete, the map is an evidence-backed current-state baseline rather than a polished guess. Chapter 9 will use the order-level records to study distributions, P90 lead time, WIP, throughput, and the 5:00 p.m. customer promise. Carry the verified map, revision record, worksheets, and original log into that analysis.
ImportantMini-Workshop: Map the Current Process
Using the completed table and the SPPM conventions, sketch the current process on paper or in a drawing tool. Include:
- the drop-off-to-ready-notification boundary,
- one customer order as the unit of analysis,
- the six main activities,
- compatible loads that reunite before folding,
- the Batch Release and Notification Batch queues,
- the evidenced Fold correction path,
- role, mean P/T, mean W/T, and mean S/T where appropriate.
Then answer:
- Which work is clearly value-added?
- Which queue dominates the current state?
- What main-path lead-time estimate do the displayed means imply?
- What information does that estimate conceal?
- Which delay should the team investigate first, without yet claiming a root cause?
TipSample Answers
- Wash, Dry, and Fold and package directly transform the laundry and are VA.
- The Batch Release queue before Wash dominates, with a mean W/T of 501.7 minutes.
- The map that combines load-level and order-level averages does not support a valid lead-time estimate by simple addition. Use the order summary instead: mean P/T is 104.5 minutes, mean W/T is 554.0 minutes, and mean S/T is 4.1 minutes, for a mean operating lead time of 662.6 minutes including observed rework.
- The estimate conceals large order-to-order variation, the queue’s growth over the day, different weights and load counts, and the five correction cases.
- Investigate the serial batch-release rule and the queue it creates before Wash.
8.9 Exercises
1. Bloom:Analyze Using the completed Wash n’ Fold table, explain why Wash, Dry, and Fold and package are VA while Drop-off and ticket, Sort and tag, and Stage and notify are RNVA. Identify one NVA queue and one NVA rework activity from the same evidence.
TipAnswer
Wash, Dry, and Fold and package directly transform the laundry into the clean, dry, folded product the customer receives and values, so they are VA. The other three main activities support traceability, safe processing, staging, and communication without directly transforming the laundry, so they are RNVA. The Batch Release queue is NVA waiting, and Fold correction is NVA rework.
2. Bloom:Analyze A small dental practice handles patient appointments as follows: the room is cleaned and prepared, the patient checks in at reception, waits in the waiting room, is called to the exam room, the hygienist performs the cleaning, the dentist reviews the x-rays, performs the exam, and the patient checks out and schedules the next appointment.
Using SPPM conventions, classify each step as VA, RNVA, or NVA and briefly justify each classification.
TipAnswer
| Step | Category | Justification |
|---|---|---|
| Room setup and turnover | RNVA | Required preparation; record it as setup rather than queue wait. |
| Check in at reception | RNVA | Required for scheduling and billing; no value added to the patient’s health. |
| Wait in waiting room | NVA | Pure queue; no value is added. |
| Called to exam room | RNVA | Necessary handoff, but no clinical transformation. |
| Hygienist cleaning | VA | Directly improves the patient’s dental health. |
| Dentist reviews x-rays | VA | Clinical analysis that informs treatment. |
| Dentist exam | VA | Direct clinical value. |
| Check out and schedule | RNVA | Required for continuity and billing. |
3. Bloom:Apply Write a one-paragraph evidence summary of the representative Wash n’ Fold Friday supplied by the simulation. Include the boundary, unit of analysis, largest queue, one rework observation, and one investigation target.
TipAnswer
A strong response follows one customer order from drop-off through staging and readiness notification, identifies the 501.7-minute order-level mean Batch Release wait as the largest queue, notes that five Fold corrections were recorded among 39 orders, and proposes investigating the serial batch-release rule. It stays descriptive and does not claim a root cause that the observation has not yet tested.
4. Bloom:Evaluate A teammate proposes skipping direct observation and building the map from interviews to save time. Decide whether this is acceptable for a White Belt baseline, justify your decision, and give two evidence-quality risks.
TipAnswer
Usually no. Interviews provide context, but observation is needed to capture actual sequence, queue behavior, load handling, and rework frequency. Memory and perception can distort timings, and hidden waits or workarounds are rarely reported consistently without direct observation.
5. Bloom:Apply Point to where each artifact appears in the Wash n’ Fold application and explain what it contributes:
process boundary statement,
learner event log,
completed activity summary,
verified current-state map.
Then explain why the chapter builds them in that order.
TipAnswer
The boundary fixes the start, stop, and unit of analysis. The event log preserves row-level timestamps and context. The activity summary aggregates that evidence without discarding the source records. The verified SPPM makes the dominant queue, load behavior, and correction path visible. The order matters because each artifact constrains the next one and prevents the map from outrunning the evidence.
6. Bloom:Apply A small print shop handles rush poster orders with this observed flow:
- Receive order details and file from customer (4 min)
- Queue before design check (18 min)
- Design check and print setup (10 min)
- Queue before printer availability (25 min)
- Print run (12 min)
- Trim and package (6 min)
- Queue before pickup notification (20 min)
- Send pickup notification (3 min)
Apply the SPPM mindset:
Name the process boundary.
Identify the two biggest queues.
Calculate a first-pass total lead-time estimate.
Suggest one practical target for the first PDCA cycle.
TipAnswer
(a) Start when the customer submits the order and end when the customer is notified that it is ready.
(b) The printer queue (25 min) and pickup-notification queue (20 min) are largest.
(c) Total processing and setup time is 35 minutes and queue time is 63 minutes, so estimated lead time is 98 minutes.
(d) Investigate the 25-minute printer queue first because it is the largest observed delay.
7. Bloom:Apply For the print-shop flow in Q6, classify each queue as likely release-control delay or likely capacity-constraint delay. State one observation you would collect next to validate each classification.
TipAnswer
- Before design check (18 min): provisionally a handoff or release-control delay. Record when completed files become visible to the designer, what authorizes the check, and whether the designer is available while work waits.
- Before printer availability (25 min): provisionally a capacity-constraint delay. Record printer occupancy, downtime, job mix, and queue length through the observation period.
- Before pickup notification (20 min): provisionally a release-control delay. Compare package-completion and notification timestamps and observe whether notifications are sent immediately or accumulated.
These are hypotheses to test; the durations alone do not establish their causes.
8. Bloom:Analyze A team map shows no rework path, but three orders were relabeled in one shift. Explain why this is a mapping defect and identify how the rework should be represented and quantified.
TipAnswer
The map hides observed work that returned to an earlier activity, so it understates both effort and delay. Add a dashed rework path from the point where the labeling defect was detected back to the labeling activity, preserve each correction as its own activity record in the event log, and label the path as three recorded corrections with the relevant denominator, such as three affected orders out of the orders observed during that shift.
9. Bloom:Evaluate Review this draft: “Each customer order uses one washer and one dryer; there is no correction path; Stop means pickup and payment.” The operator says, “Some orders need compatible loads that reunite before folding. Keep pickup outside our improvement boundary. I also think breakdowns must be a major problem.” The log records 26 two-load orders and five corrections among 39 orders, with no recorded breakdowns. Produce a revision record with proposed change, accepted/rejected/not yet supported, supporting evidence, and one follow-up question.
TipAnswer
| Proposed change | Decision | Evidence | Follow-up question |
|---|---|---|---|
| Show compatible loads that reunite before folding. | Accepted | The log records 26 two-load orders, consistent with the operator’s explanation. | Which order attributes trigger each split? |
| Add a Fold correction path. | Accepted | Five corrections are recorded among 39 orders. | What defect triggered each correction? |
| End the map at staged-and-notified rather than pickup and payment. | Accepted | The approved process boundary excludes customer travel, pickup, and payment. | Does any readiness notification occur before staging is actually complete? |
| Add a machine-breakdown path. | Not yet supported | The operator suspects breakdowns, but the selected log records none. | Which maintenance or downtime record could test this claim across more Fridays? |
10. Bloom:Analyze Compare a Wash n’ Fold first-pass draft that treats every order as one load with the verified map. Identify two differences and explain why they matter for improvement decisions.
TipAnswer
The verified map shows that many orders split into compatible loads and must reunite before folding; the first-pass map hides that coordination and would distort capacity and handoff reasoning. The verified map also includes the evidenced Fold correction branch and its frequency; omitting it would understate non-value-added work and remove a quality signal from the countermeasure discussion.
11. Bloom:Apply Record or construct five event-log rows for one activity in a process of your choice. Calculate P/T, W/T, and S/T from displayed timestamps, then calculate the count, sum, and mean for P/T. State which values belong on the Map Summary Sheet, which value belongs on the map, and what warning should accompany it.
TipAnswer guidance
Answers will vary, but every row should use the same activity and time unit, preserve Queue Entry, Setup Start, Work Start, and Work End, and calculate nonnegative P/T, W/T, and S/T consistently. The Map Summary Sheet should preserve \(n=5\), the P/T sum, the mean, and a reference to the supporting log. The map should display Avg P/T with \(n=5\). The warning should explain that five observations are practice evidence rather than proof of stability and that the mean may conceal variation and relevant operating context.
8.9.1 Journal and Reflect
Describe a time when an average gave you a misleading impression of a process. What individual observation or participant disagreement would make you revise the map, and how would you preserve that evidence?
Uncertain arrivals, order weights, sorting needs, and load counts all remain present in this case. Why might that uncertainty harm a serial batch/push system more than a controlled FIFO pull system? Write 3–4 sentences without assuming that improvement requires eliminating the uncertainty itself.
8.10 Chapter Summary
- Step 7 groups comparable Wash n’ Fold activity records onto the map worksheet while preserving their source, context, counts, sums, and averages.
- Value classification distinguishes customer-valued transformation from required support work, waiting, and correction without judging the people doing the work.
- The 501.7-minute order-level Batch Release queue is the dominant current-state delay, while the 37.9-minute Notification Batch queue is a smaller persistent delay.
- Participant verification corrected a one-order/one-load drawing: compatible loads remain tied to one order and reunite before folding.
- Five observed Fold corrections support a rework path; unsupported breakdowns remain Not evidenced.
The terms in this book follow the value-stream mapping convention used by Rother and Shook: processing time (P/T) is the time a unit is actually being processed, cycle time (C/T) describes the pace of successive completions from a process or operator, changeover time (C/O) is the time required to prepare for a different product, service, or operating mode, and lead time (L/T) is elapsed time across a stated boundary (Rother and Shook 1999). This book uses setup time (S/T) for the broader preparation interval before processing begins and reserves C/O for a genuine change from one product, service, or mode to another. The terms are overloaded in the operations literature. Hopp and Spearman use cycle time for the elapsed time a job spends in the system and lead time for a planning allowance (Hopp and Spearman 1996). When reading another source, compare its definitions and time boundaries before comparing its numbers with ours.↩︎