7 Following the Work: Building the Event Log
“Go see, ask why, show respect.” — Fujio Cho
“You can observe a lot by watching.” — Yogi Berra
7.1 Why This Chapter Matters
“There has to be a better way to do this” is usually true, but intuition alone rarely tells you where to start. A process map is a great tool to help visualize a process, surface problems, and zero in on potential problem areas for further analysis. But if your map is vague or built from memory, the rest of your analysis will be weak. This chapter shows you how to capture the current state of your process with enough discipline that delays, handoffs, and rework become visible. A map drawn from unsupported guesses gives the team a business-themed fairy tale to analyze.
7.2 Learning Objectives
By the end of this chapter, the student will be able to:
- Lean Six Sigma Principles and Tools Define and justify a clear start and stop boundary for a process map. Bloom:Apply
- Data Understanding Prepare an event log and use it to preserve individual activity records before aggregation. Bloom:Apply
- Lean Six Sigma Principles and Tools Apply the first five steps of the nine-step current-state mapping workflow with consistent data capture. Bloom:Apply
- Data Understanding Identify queue points, handoff delays, and likely rework loops from observation notes. Bloom:Analyze
In the previous chapter, we began the Plan phase of the PDCA cycle by defining the problem and stating a SMART goal. Together, we said, these provide a view of where the process currently is and where it should be. But how are we going to get there from here? This chapter starts us on our journey towards completing the second vital deliverable of the Plan phase: the production of a process map.
7.3 Introduction to Process Mapping
We know the problem at Wash n’ Fold: too many same-day orders miss the 5:00 p.m. promise. Suppose we bring the staff together and ask what to do about it. Someone proposes buying another washer. Someone else thinks the employees need to work faster. A third person wants another folding station, while a fourth insists that the real problem is waiting too long to begin washing orders.
Any of these proposals might be right. At this point, however, the problem statement and SMART goal give us no reason to prefer one over the others. They tell us about the result of the process, but they do not tell us how the process produces that result. Jumping directly from a late order to a favorite solution would be a guess, even if it happened to be a lucky one.
What would we need to know before choosing an intervention? We would need to follow an order from drop-off to notification and ask:
- What happens to the order, and in what sequence?
- Where is someone actually working on it, and where is it merely waiting?
- When does responsibility pass from one person or piece of equipment to another?
- Do all orders travel the same path?
- When an order takes a different path or circles back for correction, what happened?
Notice what these questions have led us to construct. We have chosen something to follow, given its journey a beginning and an end, placed its activities in order, and marked the waits, handoffs, and alternate paths that might explain the result we care about. Arrange that account so the whole journey can be inspected at once, and what we will have created is what process improvement professionals call a process map.
A process map is an end-to-end visual model of what a unit of work actually experiences as it moves through a process. The visual form matters because the problem may not belong to any one activity viewed by itself. A delay at folding might begin with an earlier batching decision; making one step faster might merely move the queue to the next step. The map holds those relationships together so that people who ordinarily see only their own part of the work can examine the same process.
The map does not, by itself, prove a root cause. It shows us where to ask better questions and which proposed explanations deserve further investigation. It also gives later metrics a structure. Average lead time tells us how long an order took; the map helps us ask where that time accumulated, how much was work, how much was waiting, and which path the order followed. When we return in the Check phase to decide whether a tested change actually improved the process, those distinctions will matter.
There are many styles of process map, each designed to emphasize different features. For our present purposes at White Belt level, the map does not need to be fancy. A hand-drawn flowchart with waiting points, handoffs, and rough times is usually enough to reveal where the investigation should go next.
Three artifacts support the process map, and we should build them in order because each has a different job. First preserve what happened to individual work units in an event log. Then calculate the durations recorded in each row and group comparable activity records onto a mapping worksheet. The worksheet is not a second place to record the same observations; it is where we aggregate the data from the log into summary figures like the count of observations, the average times, and so on. Finally, we use that worksheet to draw the process map from the data captured in the log and worksheet.
Now we can make the method explicit. To make your process map, use this nine-step procedure:
- Define the process boundaries—the start event, stop event, and unit of analysis—and record them in the event log.
- Prepare the event log and establish its clock and timing conventions.
- In the event log, follow work units and identify the activities and variants they actually encounter.
- In the event log, record the role responsible for each activity record and each handoff.
- In the event log, record timestamps and factual notes about queues, rework, and interruptions.
- On the timing calculation worksheet, calculate each activity record’s processing time (P/T), wait time (W/T), and setup time (S/T) from its recorded timestamps.
- From the calculation worksheet, build the map worksheet by grouping comparable activity records and recording counts, average durations, and value classifications.
- From the worksheet, draw the current-state process map, selecting the queues and branches that need to be visible.
- Verify the process map with a process participant and trace any corrections back to the event log and worksheets.
Steps 3–5 are different things to notice during the same observation, not three separate visits. Do not wait until a work unit is finished to reconstruct its timestamps from memory. The important separation is between recording individual evidence and summarizing it. If the map reveals a gap, return to the observation or participant; do not fill it with an invented average.
The nine steps give us the complete route through the mapping work. This chapter follows Wash n’ Fold through Steps 1–5 and produces the event log. Chapter 8 begins by transferring that timestamped evidence to a timing calculation worksheet, then carries Steps 6–9 through the map worksheet, visual map, and participant verification.
Keep the mapping and data collection file guide beside you as you work through Chapters 7–9. It identifies the blank sheets, short worked examples, and full Wash n’ Fold references in the downloads. Choose PDF for paper, XLSX for editable worksheets with formulas, or CSV for a portable table without formulas or spreadsheet formatting.
7.4 Wash n’ Fold Project: Follow the Orders
The case places us in a dedicated Wash n’ Fold cell inside a neighborhood laundromat. The cell has two workers, six washer positions, six dryer positions, and two folding stations. The simulation supplies the record of a Friday from opening onward, and we follow customer orders rather than individual garments.
Wash n’ Fold is a constructed case, and its records come from a simulation designed to resemble a plausible Friday in a small laundry. They give us consistent observations to examine without pretending that we visited an actual shop. The same underlying demand and service conditions are preserved for the later current-versus-future comparisons.
The project goal remains the one established in Plan: reduce the percentage of same-day orders dropped off by 9:00 a.m. that are not ready and notified by 5:00 p.m. from approximately 28% to 10% within 30 days. In the representative Friday used here, 6 of 21 eligible orders missed that promise (28.6%), so our observation begins from evidence consistent with the stated baseline.
7.5 Defining the Process Boundaries
Process mapping is an exercise in observation. But before we begin observing things, we need to make some fundamental choices about what exactly we are trying to observe. Specifically, we need to lock down three choices that all have to do with boundaries:
- Start event: when does the customer’s clock begin?
- Stop event: when is the customer-facing promise fulfilled?
- Unit of analysis: what single unit are you following (one order, one patient visit, one ticket)?
If these are poorly defined, every metric downstream becomes hard to interpret or even meaningless.
Definition 7.1
The unit of analysis is the primary “thing” whose passage through the process counts as one run of the process. It might be one customer order, patient visit, service request, batch, or invoice. Choose it before recording observations so that process-level measures refer to comparable cases.
For the Wash n’ Fold case, the start and stop events are fairly clear. The process begins when one customer order is dropped off. It ends when the completed order is staged and a readiness text is sent to the phone number recorded at drop-off. Customer travel, pickup, and payment are outside this improvement boundary.
But it’s not quite as clear what we should choose as the unit of analysis for this case. Very often, the customer drops off a large load of laundry that won’t all fit in one washer or dryer. Further, to keep clothes in their best condition, we need to separate lights from darks and process them in slightly different ways.1
So what should we choose as the unit of analysis in this case? On the one hand, tracking the “customer order” seems very logical. It’s the whole order that’s dropped off and picked up at the end, after all. On the other hand, one order can get split into two or more loads.
This complex structure is very common to see in process mapping work and it can confound you if you don’t sit and think it through carefully. One customer order might involve picking and packing several different items from a warehouse. One patient might require services from several different providers at the same hospital. One service request ticket might need to pass through several different departments, each of which receives its own sub-ticket to work.
In these kinds of real-life cases, I recommend conceptualizing them as having a “one parent, many children” structure. We make the top-level entity (the customer order, the patient visit, the original customer request) the thing we track primarily, and then we capture additional information about the children as needed. So, for our Wash n’ Fold case, let’s make the unit of analysis the parent customer order, which might have one or more child loads which are processed separately, whether in parallel or in series. The Order ID therefore remains the case identifier from drop-off through notification. Orders are never mixed, even when sorting divides one order into more than one load. Those loads receive their own Load IDs, which remain linked to the parent Order ID, and reunite before folding.
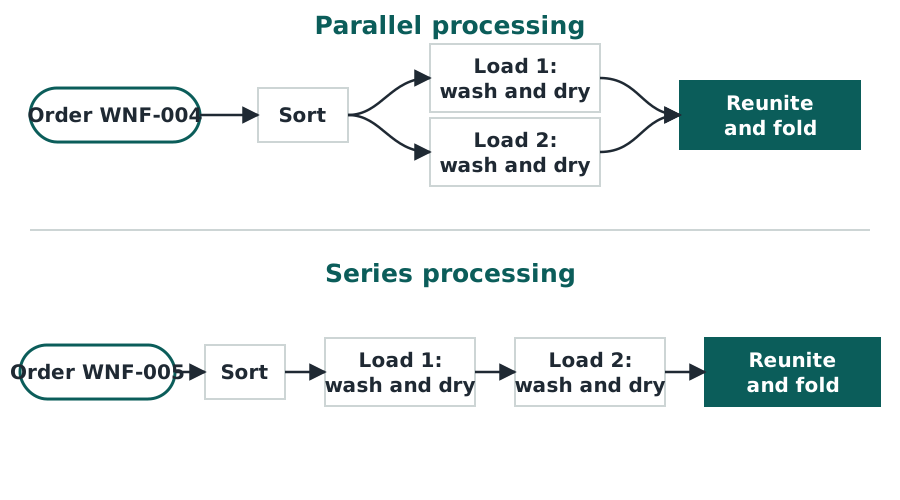
Why is the parent/child architecture the right choice for our unit of analysis in this case? Because it keeps the analysis of lead time and promise performance at the level the customer experiences, which is the order. That remains true even though the Wash and Dry steps may need to be recorded at the load level. If that distinction still feels a little tangled, keep reading. It becomes much easier to see once we put it to work.
7.6 Prepare the Event Log
We have chosen the order as the case the customer experiences. But Wash and Dry happen to loads, not to the undivided order. How can one log preserve both the customer case and the particular physical item that received the work?
Short answer: it needs a parent case identifier on every row and a child item identifier whenever the work has split.
Definition 7.2
An event log is a row-by-row record of what happens to identified units of work as they move through a process. Each row preserves enough context to say what happened, to which unit, and when. The log is the evidence from which the map worksheet, process map, and order-level summaries are derived.
For this case, the completed Wash n’ Fold log is supplied as evidence for us to inspect. The point isn’t to reconstruct it from the simulation. Rather, we want to watch each row acquire the information that makes it useful.
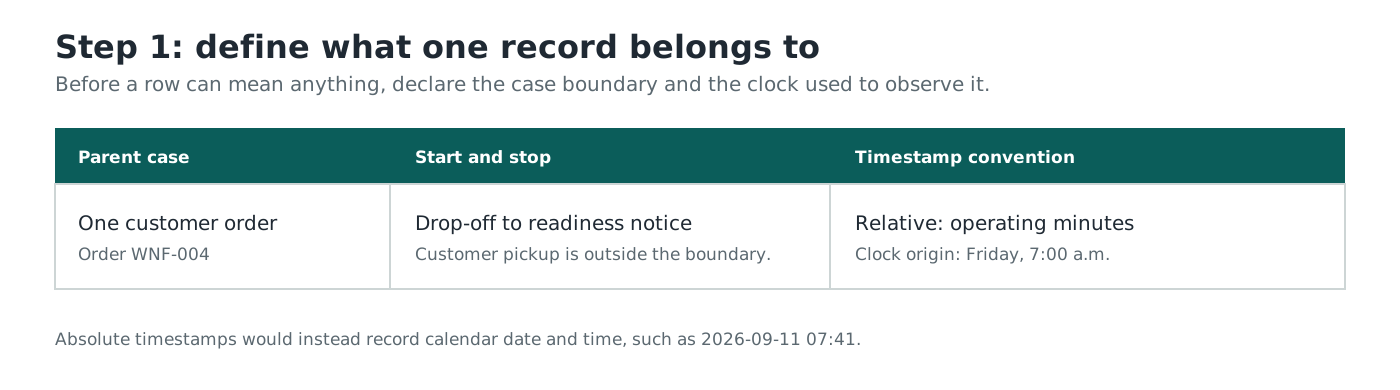
Before recording a timestamp, choose between absolute and relative time. An absolute timestamp records a date and time, such as 2026-09-11 07:41. Use it when work may cross shifts, days, locations, or systems and another reader must know when it occurred in calendar time. Relative time records elapsed time from a stated clock origin, such as 40.6 operating minutes from Friday at 7:00 a.m.. It makes intervals easy to compare within one bounded observation window.
An operating-time clock counts only periods when the process is open or scheduled to work, so it pauses when the business is closed nights and weekends. A calendar-time clock continues to tick during those periods. Either clock can answer a useful question, but they produce different lead times. Name the timestamp convention, clock, time zone when applicable, and clock origin for relative time before comparing records.
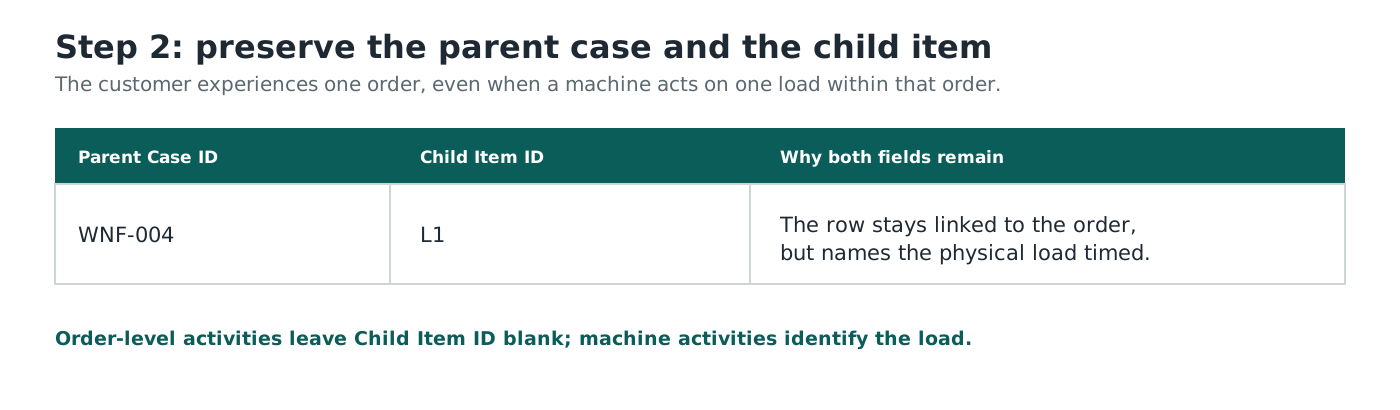
The Parent Case ID remains on every row because the order is the unit of analysis. The Child Item ID is blank for activities such as Drop-off and ticket or Fold and package, which act on the whole order. For Wash and Dry, it identifies each physical load while retaining its link to the order. If work returns to an activity, add another row and increase the pass number.
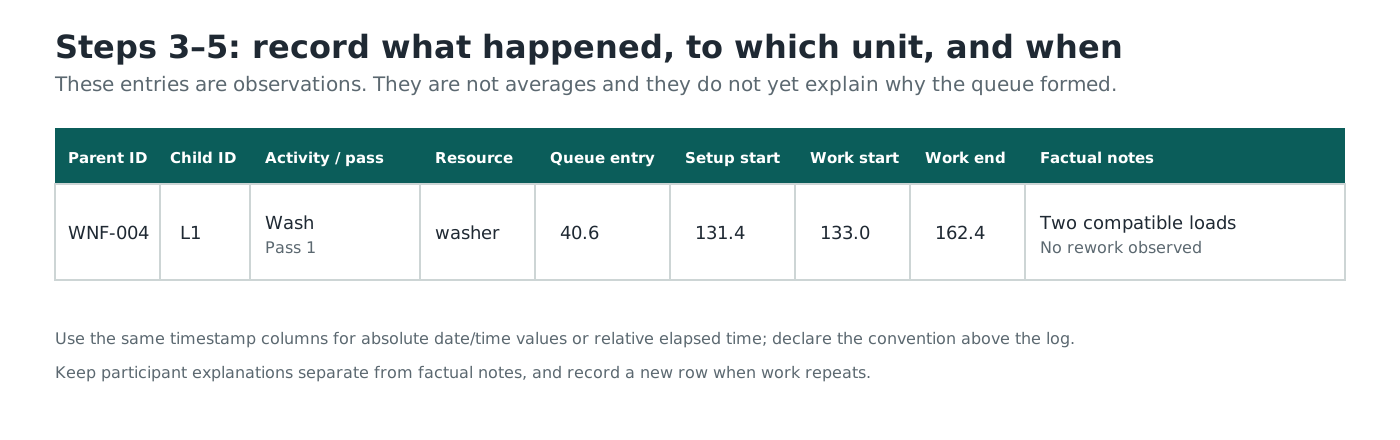
The four timestamps are observations. The notes preserve directly observed context, not a conclusion about why the work waited. This row reports that two compatible loads existed and that no rework was observed; it does not claim a cause for the queue.
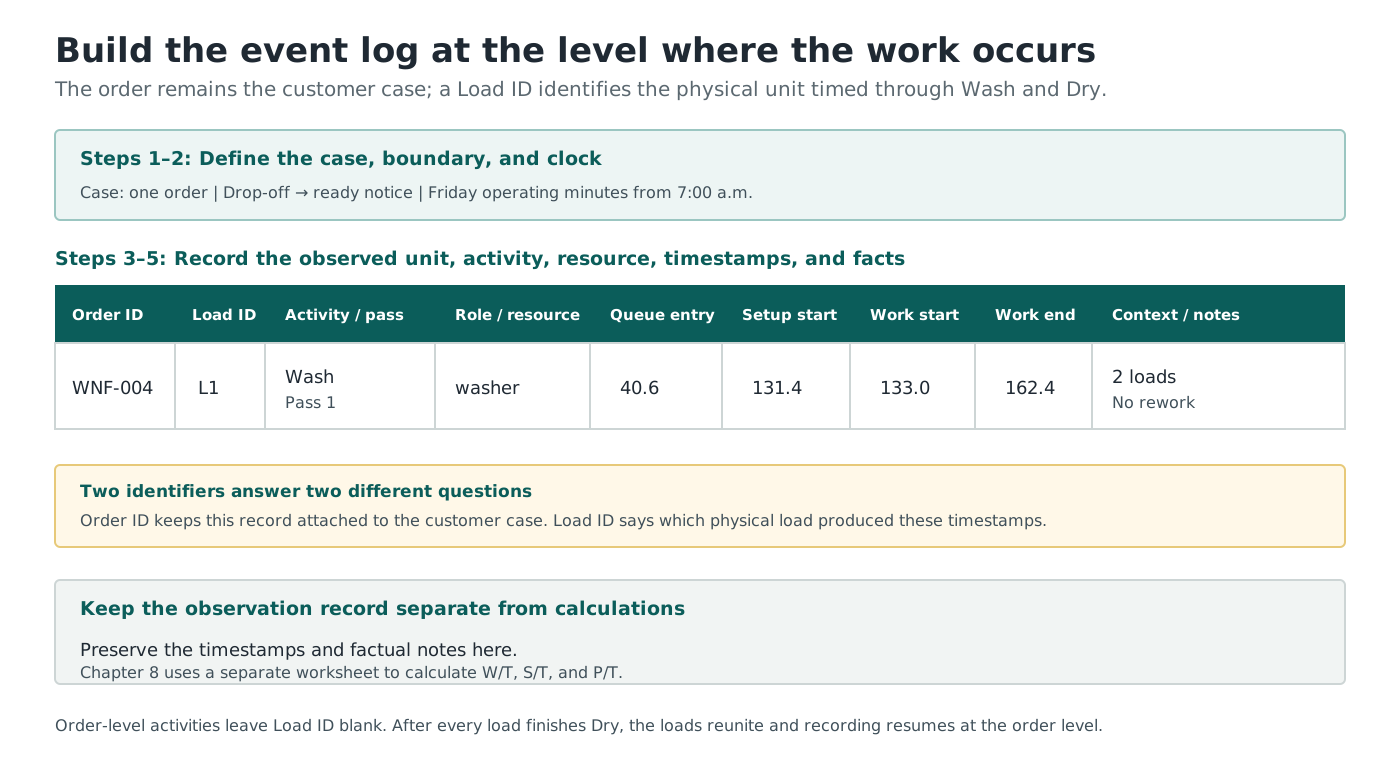
The complete record is available in four forms: open the completed Wash n’ Fold record in a browser, download the completed PDF, download the completed CSV, or download the completed workbook. These are the full 291-record references. For your first calculation in Chapter 8, use the five-record source excerpt (CSV) or its printable copy (PDF): the L1 Wash records for WNF-001 through WNF-005. The smaller file preserves the same fields and values as the full log; it selects the records rather than inventing a simpler dataset. These are supplied instructional evidence for this case. Chapter 8 begins by calculating durations from this evidence before grouping or summarizing it.
7.7 Follow Work Units Through Major Activities and Variants
The most common mapping mistake is probably trying to map from memory. Memory is simply unreliable here, though. We tend to forget or gloss over small details, and our memories are often shaped more by exceptions than regularities. Since what is abnormal stands out more clearly in memory, describing a process from memory always comes with an innate risk of painting a picture distorted by extremes.
That is why current-state mapping should start with direct observation wherever possible. For White Belt work, your goal is not to document every tiny detail the way a full technical design document would. Rather, your goal is to visualize the real flow (or lack of it) so a team can spot delays, handoffs, and rework and take action quickly. In other words, we need to make the flow of work and delay visible enough to support the first PDCA cycle.
Document what happens in sequence, including waiting, interruptions, and workarounds. Do not map the policy manual. If procedure and reality differ, that difference is itself useful process data.
This is Step 3 of the workflow: follow work units and name the activities and variants they actually encounter. List the major activities in the order they occur. Again, capture what does happen, not what should happen.
For first-pass White Belt mapping, target 5–10 major steps. Fewer than five often hide useful detail; more than ten usually means you are mixing levels of detail.
Consider a quick illustration. A team is trying to map an order process:
- Too broad (3 steps): Receive order -> Process order -> Deliver order.
- Usable (7 steps): Receive -> Verify -> Queue -> Process -> Inspect -> Stage -> Deliver.
- Too granular (18+ steps): every click, every form field, every hand motion.
That gives us the right level of detail for the Wash n’ Fold process spine:
Drop-off and ticket → Sort and tag → Wash → Dry → Fold and package → Stage and notify.
This sequence names the major activities; it does not mean that every activity acts on the same physical object. The Order ID follows the customer order across the entire process. After Sort and tag, an order may become one or more identified loads. Record Wash and Dry separately for each Load ID, retain the parent Order ID on those rows, and resume order-level recording once all of the order’s loads reunite for folding.
7.7.1 Process Variants
Definition 7.3
A process variant is a recurring alternative path for the same process. By “the same process” here we mean that the variants share the same start event, stop event, and primary unit of analysis. They may have different numbers of steps, put the steps in a different order, or differ meaningfully in who performs the steps, the materials involved, or some other important condition.
Process variants are very common in real operations due to product mix, customer type, staffing differences, and exception handling.
Preserve variants before summarizing:
- Record the branch taken by each work unit and its trigger (for example, order type, customer tier, or product category).
- Use a Variant field or factual Notes in the event log; carry the distinction into the worksheet and map later.
- Record the key trigger for the variant (for example, “premium vs. standard service”, “urgent vs. standard order”).
- Time each variant path separately so you capture the actual cycle and wait times for each.
The number of loads is important context, but it is not automatically a different process variant. Orders WNF-001 through WNF-005 follow the same major path as one-load orders; they simply have two Wash records and two Dry records, one for L1 and one for L2. The Load ID prevents two machine cycles from being mistaken for one activity record while the Order ID preserves the fact that both belong to the same customer case.
At White Belt level, document variants explicitly during observation, but establish one primary baseline map for the first cycle. This keeps scope manageable while preserving evidence about meaningful differences across runs.
7.8 Record Who Owns Each Step
Record who performs each step so handoffs and role boundaries are explicit in your notes. If the ‘who’ changes from run to run, that is important data too. Best practice is to identify individuals by role or job title rather than by name. In very small businesses, you can get away with names, but as a business grows more complex this quickly becomes unworkable.
For Wash n’ Fold, the customer and a worker participate in drop-off; cell staff perform the remaining activities. The Order ID remains attached through every handoff, and Load IDs identify the physical units handled by washers and dryers.
| Name | Type | Who |
|---|---|---|
| Drop-off and ticket | Step | Customer, Staff |
| Sort and tag | Step | Staff |
| Wash | Step | Staff |
| Dry | Step | Staff |
| Fold and package | Step | Staff |
| Stage and notify | Step | Staff |
7.9 Record Timestamps, Queues, Rework, and Interruptions
For each activity record, enter the Order ID, any applicable Load ID, activity, pass number, role/resource, Queue Entry, Setup Start, Work Start, and Work End. Record timestamps as events happen, including repeated activities. Keep participant explanations and hypotheses distinguishable from things directly observed. At this step, we tag three additional flow signals that often dominate lead time in practice: queues, rework loops, and interruptions. Your goal here is disciplined capture, not perfect diagnosis. Chapter 8 calculates and groups these records before Chapter 9 interprets the resulting baseline.
7.9.1 Queue: Pure Waiting
Definition 7.4
A queue is a state where work items sit idle, waiting for the next process step to begin. A queue adds wait time rather than processing time. Record all queue time in the event log’s W/T calculation, record visible queue counts with their observation times, and draw a queue triangle when the waiting state is large or diagnostically important.
7.9.2 Rework Loop: Work That Circles Back
Definition 7.5
A rework loop is a path where work returns to an earlier step because a defect, omission, or mismatch was found. Rework loops increase total effort and delay; they are a cost multiplier on total processing time and lead time and indicate quality problems. Add a row for each pass through the correction activity, linked to its work unit. On the worksheet, record the trigger, destination, and frequency with its denominator, such as 5 affected orders out of 39.
7.9.3 Interruption: When Flow Stops
Definition 7.6
An interruption is a stop or diversion that pauses the normal flow of a work unit, usually to handle an urgent exception or priority task. Interruptions increase variation and make processing-time and completion-pace estimates less stable. Record the source, duration, and point in the activity in Notes so repeated patterns can be investigated later.
7.9.4 Move from Observation to Event-Log Entry
The preceding definitions tell you what to notice. Now enter each observed activity record in the event log, preserving its parent Order ID, any applicable Load ID, activity name, pass number, role, timestamps, and factual context. Use Notes for the evidence behind a queue, rework, or interruption label; keep a participant’s explanation or your own hypothesis visibly separate from direct observation.
At the end of each run, ask:
- Did any work have to cycle back? If yes, record it in the Notes column with trigger and destination.
- Did anyone interrupt this step? If yes, record the source and duration.
- Did work pile up before this step? If yes, count the waiting units and record the observation time in Notes; label an estimate as an estimate.
After at least five runs:
- Tally how many times rework occurred and where it went back to.
- Note any recurring interruptions and their frequency.
- Identify the steps with the largest waits and visible queues.
Simple counts and percentages are useful at White Belt: distinguish five recorded corrections from five distinct affected orders. More detailed interruption-cost and variation analysis can follow at Yellow Belt.
For your own capstone observation, use the blank event-log template after you have chosen the boundary, unit of analysis, and timestamp convention. It supports absolute or relative timestamps and an optional child item identifier when work splits. Open the template in a browser, download the A4 color PDF, A4 B&W PDF, Letter color PDF, Letter B&W PDF, the CSV, or the editable workbook. Repeat the blank print page as needed. Keep the event log as your observation record; Chapter 8 supplies the separate sheets for calculations and summaries. Carry your boundary, clock convention, parent and child IDs, timestamps, and factual notes forward with the records you calculate.
Collect timestamped observations from at least 5 runs before summarizing a step’s timings on the worksheet.
- Five runs are a practice starting point, not proof that the process is stable or that the baseline is representative.
- If timings or paths differ, keep observing and record the circumstances; no fixed small count guarantees that rare events or busy periods have been captured.
- Keep context consistent: same process boundary, similar time windows, and similar staffing conditions.
At White Belt level, rough but consistently collected timings are sufficient. Precision matters less than a stable method.
We now have trustworthy timestamped records of what happened to individual Wash n’ Fold orders. Chapter 8 begins by calculating the timing intervals those records support, then asks how to turn dozens of calculated rows into a process we can inspect as a whole.
7.10 Exercises
1. Bloom:Understand For each statement below, label it Observed Condition or Assumed Cause:
- “Orders wait 20 to 40 minutes before final packaging starts.”
- “The staff is disorganized during shift handoff.”
- “Three orders returned to the labeling step in one afternoon.”
- Observed Condition
- Assumed Cause
- Observed Condition
2. Bloom:Apply Choose a process you know and draft a mapping boundary in two sentences:
- sentence one defines start and stop events from the customer point of view,
- sentence two defines the unit of analysis.
Answers vary. Look for clear customer-centered boundaries and one explicit analysis unit (for example, one invoice, one service ticket, one order).
3. Bloom:Analyze A team produced this observation snippet:
- Intake: 4 min work, 0 min wait
- Verification: 6 min work, 18 min wait
- Approval: 3 min work, 22 min wait
Which two delays should be prioritized first, and what does this suggest about flow quality?
Priority should go first to Approval wait (22 min), then Verification wait (18 min), because they are the largest queues. This shows poor flow continuity in the middle of the process and directs the next observation toward the handoffs, release rules, and available capacity around those queues.
4. Bloom:Analyze A team recorded processing times for the same process step over five runs (in minutes):
\[ 2,\ 3,\ 4,\ 9,\ 2 \]
- Which record most needs additional context in the event log?
- What should the observer check or record before deciding how to interpret it?
- Should the team treat these five records as a stable baseline yet?
- The 9-minute record most needs additional context because it differs sharply from the other four.
- Check the timestamps for a recording error and preserve factual context such as the work type, staffing, interruption, or equipment condition in Notes.
- Not yet. Five runs are a practice starting point, and the unexplained 9-minute record is a reason to keep observing rather than discard it or declare the process stable.
5. Bloom:Apply Select one recurring process from work or daily life and complete the following before drawing anything:
- Write the start event, stop event, and unit of analysis.
- Prepare event-log fields for the case ID, any child item ID needed when work splits, repeated passes, roles, timestamps, and factual notes.
- Identify one likely queue point and one likely handoff risk to verify during observation.
Answers will vary. A usable response names observable start and stop events, follows one consistent kind of case, keeps the case ID when work splits into separately processed items, prepares row-level timestamp fields rather than prefilled averages, and treats the proposed queue and handoff as things to verify rather than established causes.
In the next chapter, we group comparable event-log records onto the map worksheet and convert that evidence into a current-state map.
6. Bloom:Apply Draft one observation note that is high quality and one that is low quality. Briefly explain why another reader can check the high-quality note.
High quality: “Order 14 entered the approval queue at 10:12 a.m.; work began at 10:31 a.m.; the approver said the prior meeting ran late.”
Low quality: “Approval is always slow because the manager is disorganized.”
The first note identifies the work unit, timestamps, and the source of the explanation while keeping observation separate from a participant’s account. The second generalizes from no stated evidence and presents an assumed cause as fact.
7. Bloom:Analyze An event log shows a long wait before approval but does not identify the roles on either side of the handoff. Explain what information is missing and why that weakens countermeasure design.
The log does not show which role releases the work, which role receives it, what authorizes the transfer, or when responsibility changes. Without that information, the team cannot tell whether the queue reflects a release rule, missing information, unavailable capacity, or some other mechanism, so a proposed countermeasure would outrun the evidence.
8. Bloom:Understand Why should process variants be documented during observation even if only one primary baseline map is built first?
Variant records preserve which units followed different paths and why. That evidence prevents the primary map from being mistaken for a universal path and lets the team decide later whether a variant is necessary, wasteful, or important enough to map separately.
9. Bloom:Analyze A team has five observations with one extreme outlier. Describe one decision rule for when to keep collecting versus when to use the observations as a provisional baseline.
Keep the outlier unless a documented measurement or data-entry error justifies correcting it, record its operating context, and collect more observations whenever the team cannot yet explain whether that context is recurring or exceptional. Five observations are enough for this practice exercise, but not enough to declare a stable baseline merely because four values are close together.
7.10.1 Reflection Question
Write three or four sentences on one process where you might be tempted to infer causes too early, and how you will force yourself back to observed conditions first.
Think of a time when a record or direct observation contradicted someone’s confident account of how work usually happened. How could you preserve both sources without treating either one as automatically correct, and what would you observe next?
10. [Stretch] Bloom:Evaluate You must choose between two first-cycle observation approaches:
- observe one process variant deeply,
- observe three variants lightly.
Which approach is better for a first White Belt cycle, and why?
Usually approach 1 is better. A single, well-observed baseline yields clearer metrics and actionable countermeasures, while three shallow maps often spread effort too thin and delay improvement. If variant risk is high, note variants during observation, but keep one primary baseline for the first cycle.
7.11 Chapter Summary
- Current-state mapping is a disciplined observation workflow, not a memory exercise or a polished drawing exercise.
- The Wash n’ Fold boundary follows one customer order from drop-off through staging and readiness notification on an operating-time clock.
- Preserve individual activity records in the event log before calculating or summarizing the process on the worksheets.
- Queues, rework loops, and interruptions are not side notes; they are critical flow signals that often explain lead-time inflation better than the nominal step list alone.
- Chapter 8 calculates timing intervals from these individual records, then turns the results into the map worksheet and verified current-state process map.
7.12 Further Reading
Samuel H. Scudder’s account of studying a fish under renowned naturalist Louis Agassiz provides a brief but brilliant account of the power—and challenge—of observing something scientifically.
Yes, really. See Tide’s guide to sorting laundry.↩︎